
Internet Connected News Feeds and Music Visualizer
Fun With LED Matrices
Everything you need to know about setting up off the shelf hardware to scroll news, weather, and more.
How This All Started
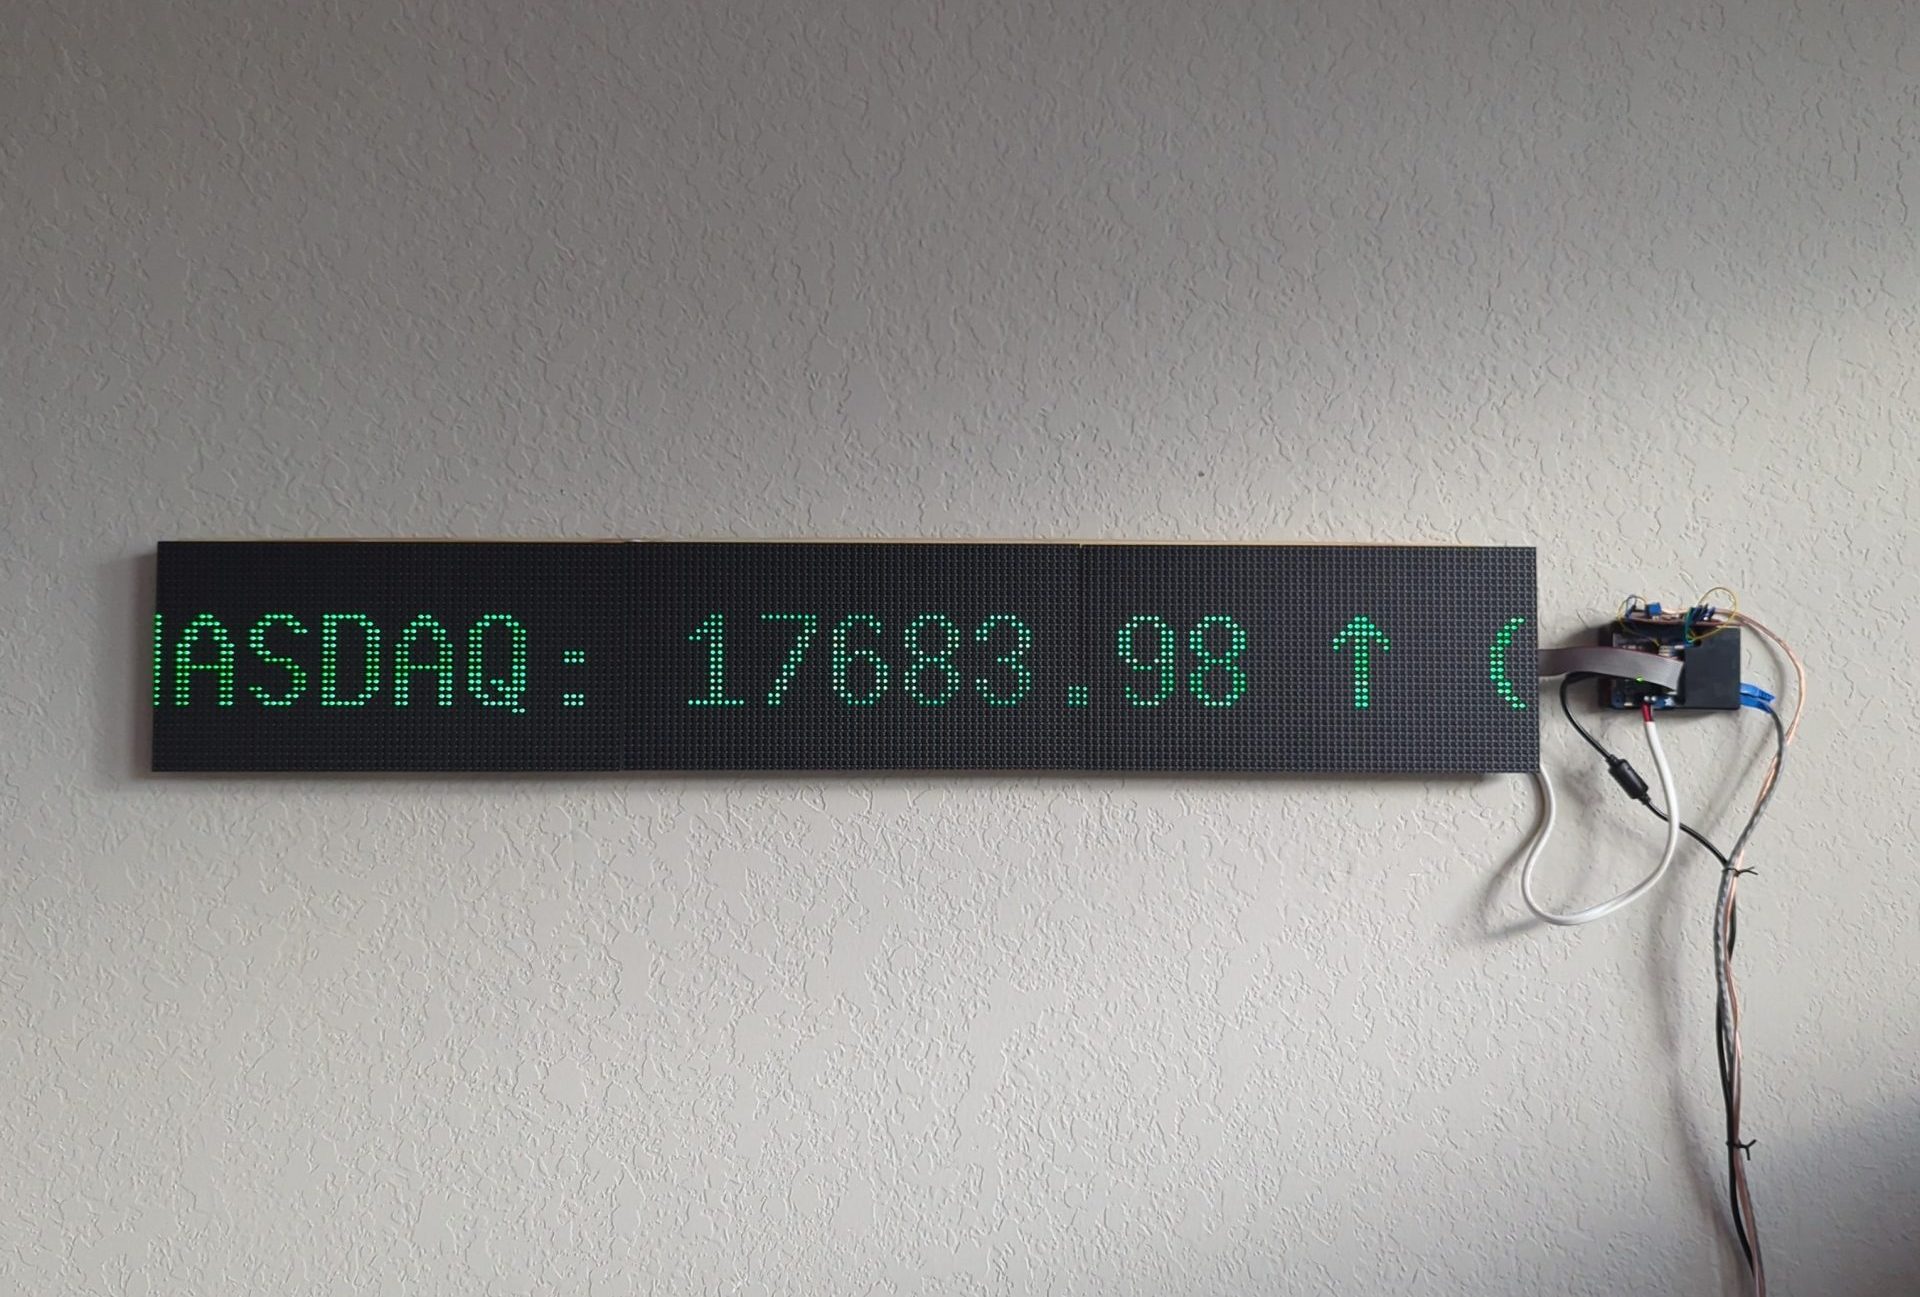
Some time ago I purchased the Adafruit RGB Matrix hat for the Raspberry Pi (https://tinyurl.com/3upwzy5j), along with three generic 32×64 pixel RGB matrices off of Aliexpress. This plus a heftly 5V power supply and a Raspberry Pi 4 gave me all I needed to get stared. I wanted some more practice with Python and I went on to use this hardware to create some fun custom displays. It remains a somewhat awkwardly mounted above the TV in my living room.
Project Details
My first project required no additional hardware and between 8:00 and 10:00am turns on and informs me of the daily headlines, weather, and stock index prices. Headlines come from the RSS feeds of the BBC, NYT, and WaPo, and the weather and stock indexes are found with free API keys. I had a bit of trouble getting this code to start and stop at the appropriate times but that has since been resolved. The setup instructions I have included elsewhere will walk you through exactly how to configure the appropriate services. Automatic startup upon reboot is done by modifying the Pi’s rc.local file.
My code is only designed to start at a specific time, so for debugging I added a line for a test mode so I could write “–test” at the end of the run command in the console to override this condition and start it for testing/debugging.
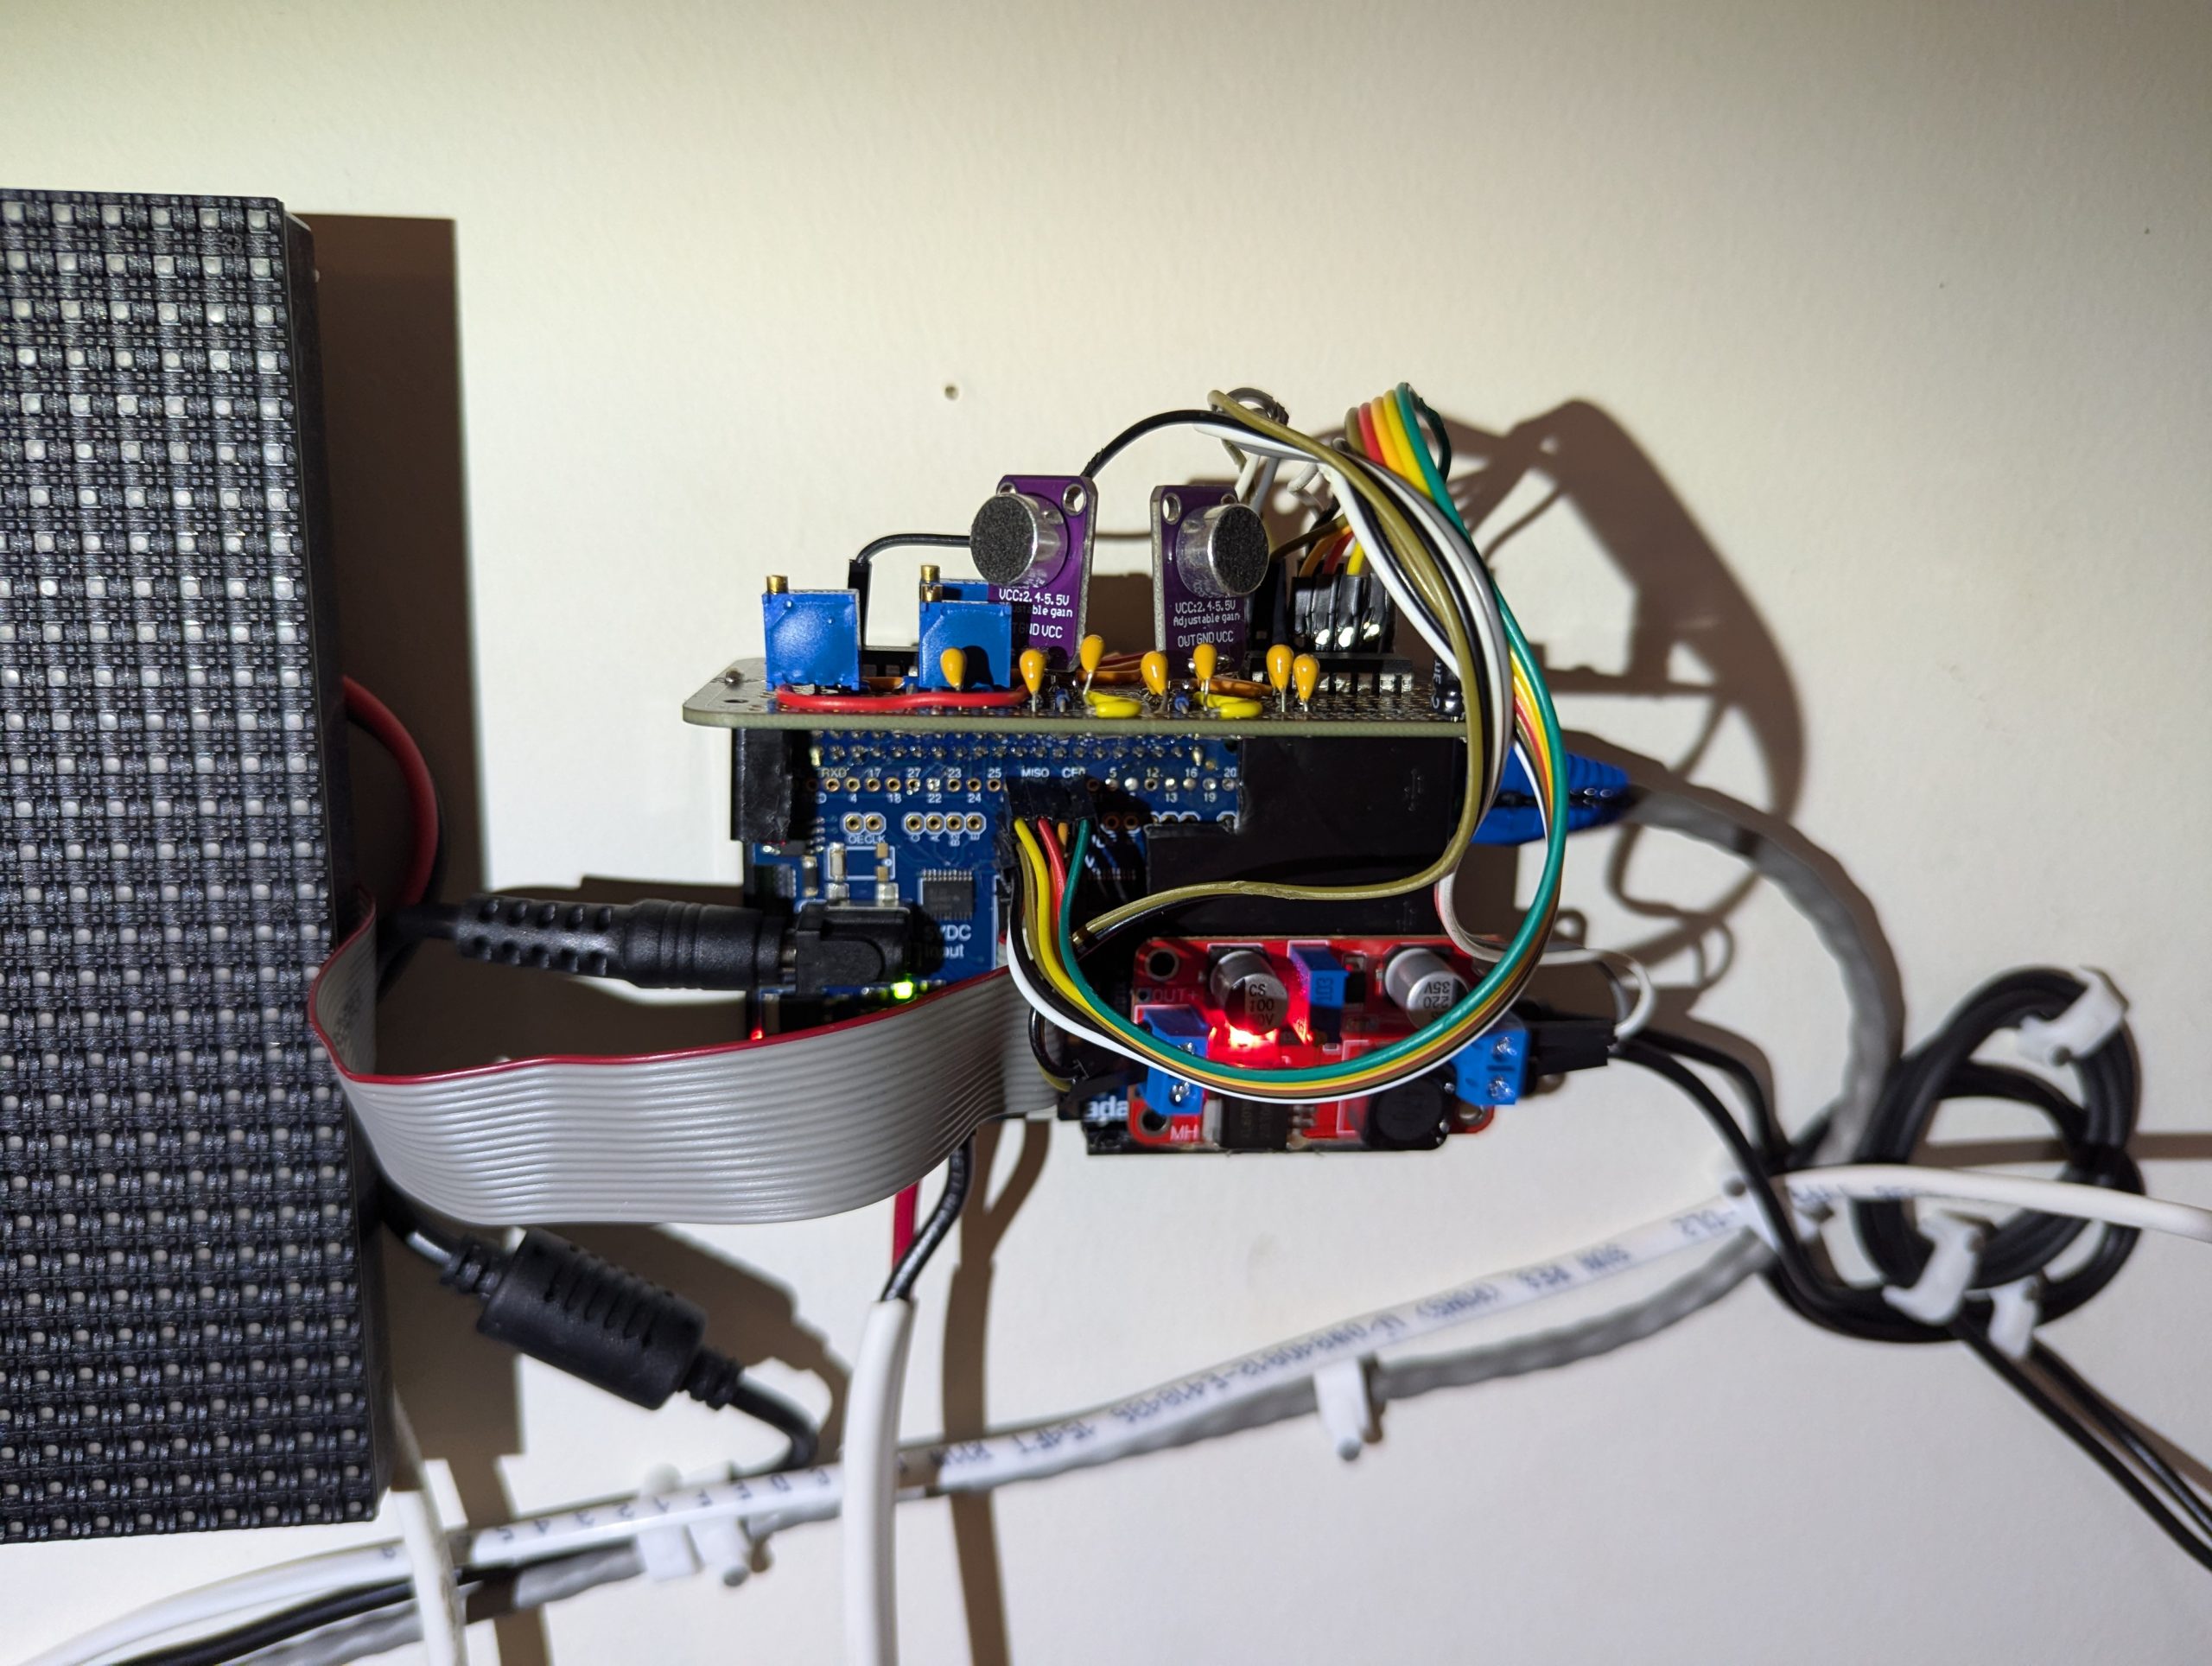
My next project with these displays was a bit more ambitious. I wanted to display the audio spectrum of the music I was listening to using a Fourier transform. This project takes advantage of the fact that the matrix controller hat does not burden the SPI pins, so I could connect a MCP3008 ADC to deliver sampled audio. This is a 10 bit 8-channel analog to digital converter chip, in theory only one channel is needed, but I attached two mics so that I can receive from two directions and average the signal. Audio is received from a general purpose electret microphone module that contains an integrated adjustable op amp. This produces a 5V max peak to peak signal centered around 2.5V, which is reduced to 3.3V peak to peak for the safety of the DAC by an additional op amp circuit.
Before I even started trying to display real audio I wanted to establish that I could run the FFT (Fast Fourier transform) and display the results. I wrote some code that used dummy audio as the input and initially had some real trouble stabilizing the display, even with a simple and predictable input. Eventually that got resolved well enough to move on and I added a bit of code to change the color with the intensity of the signal at a given frequency. At this point I needed to decide what frequency range I wanted to display. Human hearing ranges from about 20 Hz to 15 kHz, but most recorded music is in a narrower band. My first thought was since I have 192 horizontal pixels, to have each represent 30 Hz, and just display frequencies from 30 – 5730 Hz evenly. However, human hearing discriminates logarithmically in both the frequency response and amplitude response of the sound we hear. For my display to match how we perceive sound my response functions must reflect that. While this display will still cover the range up to 5760 Hz, it is now centered around about 1 kHz to more accurately display how we hear the intensity of sound since we notice the difference between 500 Hz and 1kHz much more distinctly than we do the difference between 4500 Hz and 5 kHz. The Amplitude is also scaled non-linearly.
Noise has been a persistent issue with this project. My hand soldered board includes decoupling caps on all the power lines and signal lines, but ghost output remained a persistent problem. The problem may lie with the cheap microphones I am using, and the only way I have been able to get a response on the display that really matched the music I was listening to has been to move the mic(s) very close to the speakers, to increase the signal to noise ratio.
LED Matrix Hardware
The Adafruit RGB Matrix HAT or Bonnet connects the Raspberry Pi to a HUB75 LED matrix using roughly thirteen GPIO signals rather than a standard bus such as SPI. Almost the entire set of Pi GPIO pins are used, conviniently leaving me just enough to connect an ADC via SPI.
Matrix Color Pins:
Pi GPIO #5 – Matrix R1 (Red row 1) pin
Pi GPIO #13 – Matrix G1 (Green row 1) pin
Pi GPIO #6 – Matrix B1 (Blue row 1) pin
Pi GPIO #12 – Matrix R2 (Red row 2) pin
Pi GPIO #16 – Matrix G2 (Green row2) pin
Pi GPIO #23 – Matrix B2 (Blue row 2) pin
Matrix Control pins:
Pi GPIO #4 – Matrix OE (output enable) pin
This pin controls whether the LEDs are lit at all
Pi GPIO #17 – Matrix CLK (clock) pin
This pin is the high speed clock pin for clocking RGB data to the matrix
Pi GPIO #21 – Matrix LAT (latch) pin
This pin is the data latching pin for clocking RGB data to the matrix
RGB Matrix Address pins
Pi GPIO #22 – Matrix A (address A) pin
This pin is part of the 1->16 or 1->8 multiplexing circuitry.
Pi GPIO #26 – Matrix B (address B) pin
This pin is part of the 1->16 or 1->8 multiplexing circuitry.
Pi GPIO #27 – Matrix C (address C) pin
This pin is part of the 1->16 or 1->8 multiplexing circuitry
The HAT is not a display controller or framebuffer. The Raspberry Pi itself generates the RGB data, clock, latch, row-address, and output-enable timing. The HAT mainly routes those signals to the 16-pin HUB75 connector, passes them through 74AHCT245 buffers that translate the Pi’s 3.3V GPIO signals into stronger 5 V logic signals, and provides convenient panel-power connections. The shift registers, output latches, row-selection circuitry, and constant-current LED drivers are located inside the matrix panel itself.
For a 64×32, 1/16-scan panel, each clock pulse loads six bits in parallel: red, green, and blue data for one pixel in an upper row and the corresponding pixel in a lower row. After 64 clock pulses, one complete bitplane for a pair of rows has been shifted into the panel. The Pi briefly blanks the display with OE, pulses LAT to copy the shift-register contents into the panel’s output latches, selects the desired row pair with A–D, and enables OE so that bitplane is immediately shown. This is repeated for all eight weighted bitplanes and all sixteen row pairs, requiring 8,192 clock pulses and 128 latch pulses per full 24-bit RGB refresh. The panel never stores an entire 24-bit image internally; the apparent full-color image is assembled over time by rapidly displaying one bitplane of one row pair at a time.
Brief Overview of the Theory Behind the Fast Fourier Transform
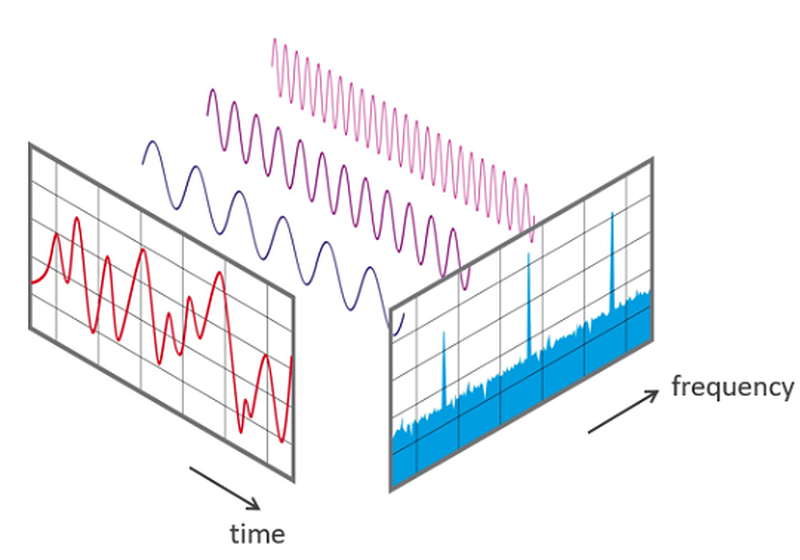
An audio Fourier transform converts a finite block of uniformly sampled time-domain data into a frequency-domain representation. The discrete Fourier transform, or DFT, compares the sampled waveform against a set of sinusoidal basis functions and produces a complex value for each frequency bin. The magnitude of each complex result indicates how strongly that frequency is present, while its phase describes the timing of that sinusoidal component relative to the sample block. Because real audio signals produce a spectrum that is symmetric about zero frequency, only the positive-frequency half is displayed.
The measurable bandwidth is determined primarily by the sampling rate. For a sampling frequency Fs, the highest uniquely representable frequency is the Nyquist frequency, Fs/2; any input energy above this limit aliases into the measured band unless removed by an analog low-pass filter before sampling. The spacing between adjacent DFT bins is
Delta F = Fs/N, where N is the number of samples in the transform. Equivalently, because the sample block lasts T = N/Fs seconds, Delta F = 1/T.
Thus, increasing the sampling rate while keeping N fixed increases the observable bandwidth but also makes the bins farther apart. Increasing N while keeping the sampling rate fixed produces more closely spaced bins and finer frequency discrimination, but requires a longer acquisition interval and therefore increases latency.
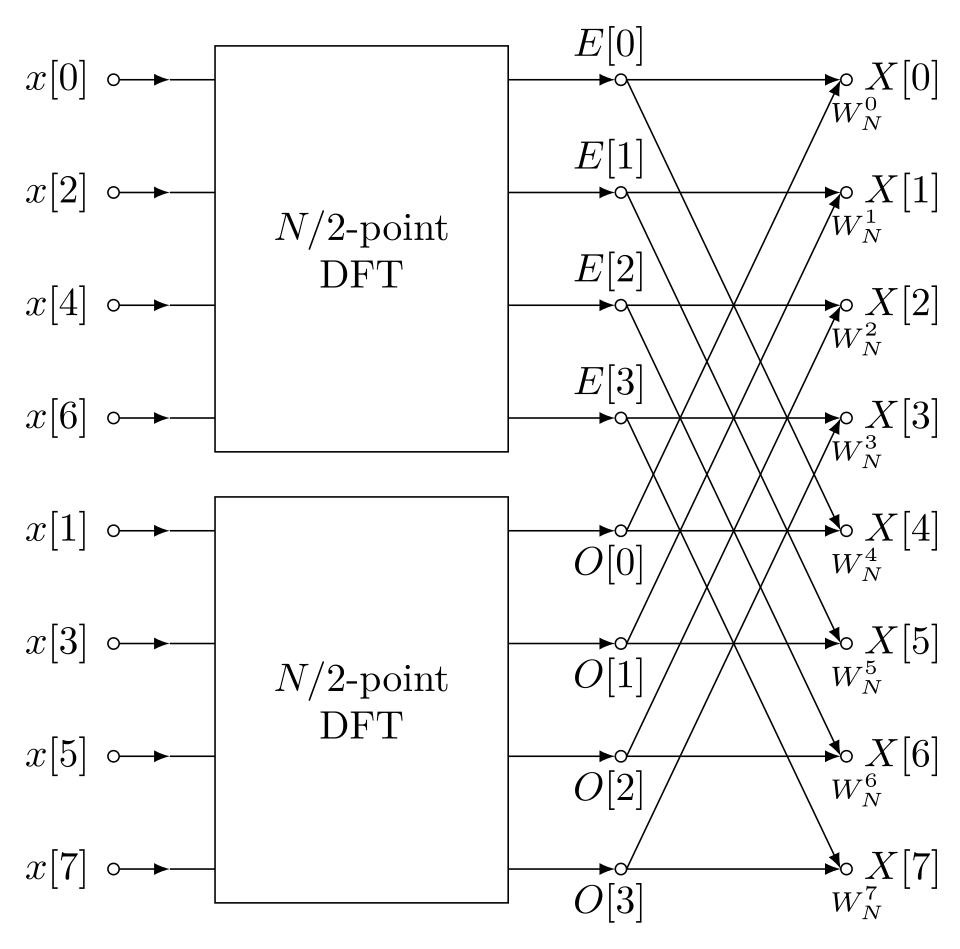
The fast Fourier transform, or FFT, is an efficient algorithm for computing the same result as the DFT. A direct DFT requires on the order of N^2 operations, whereas an FFT reduces this to approximately N*log2(N) by recursively decomposing the transform into smaller calculations called butterflies. The FFT does not change the bandwidth, bin spacing, or underlying frequency information; those are determined by the sample rate and record length.
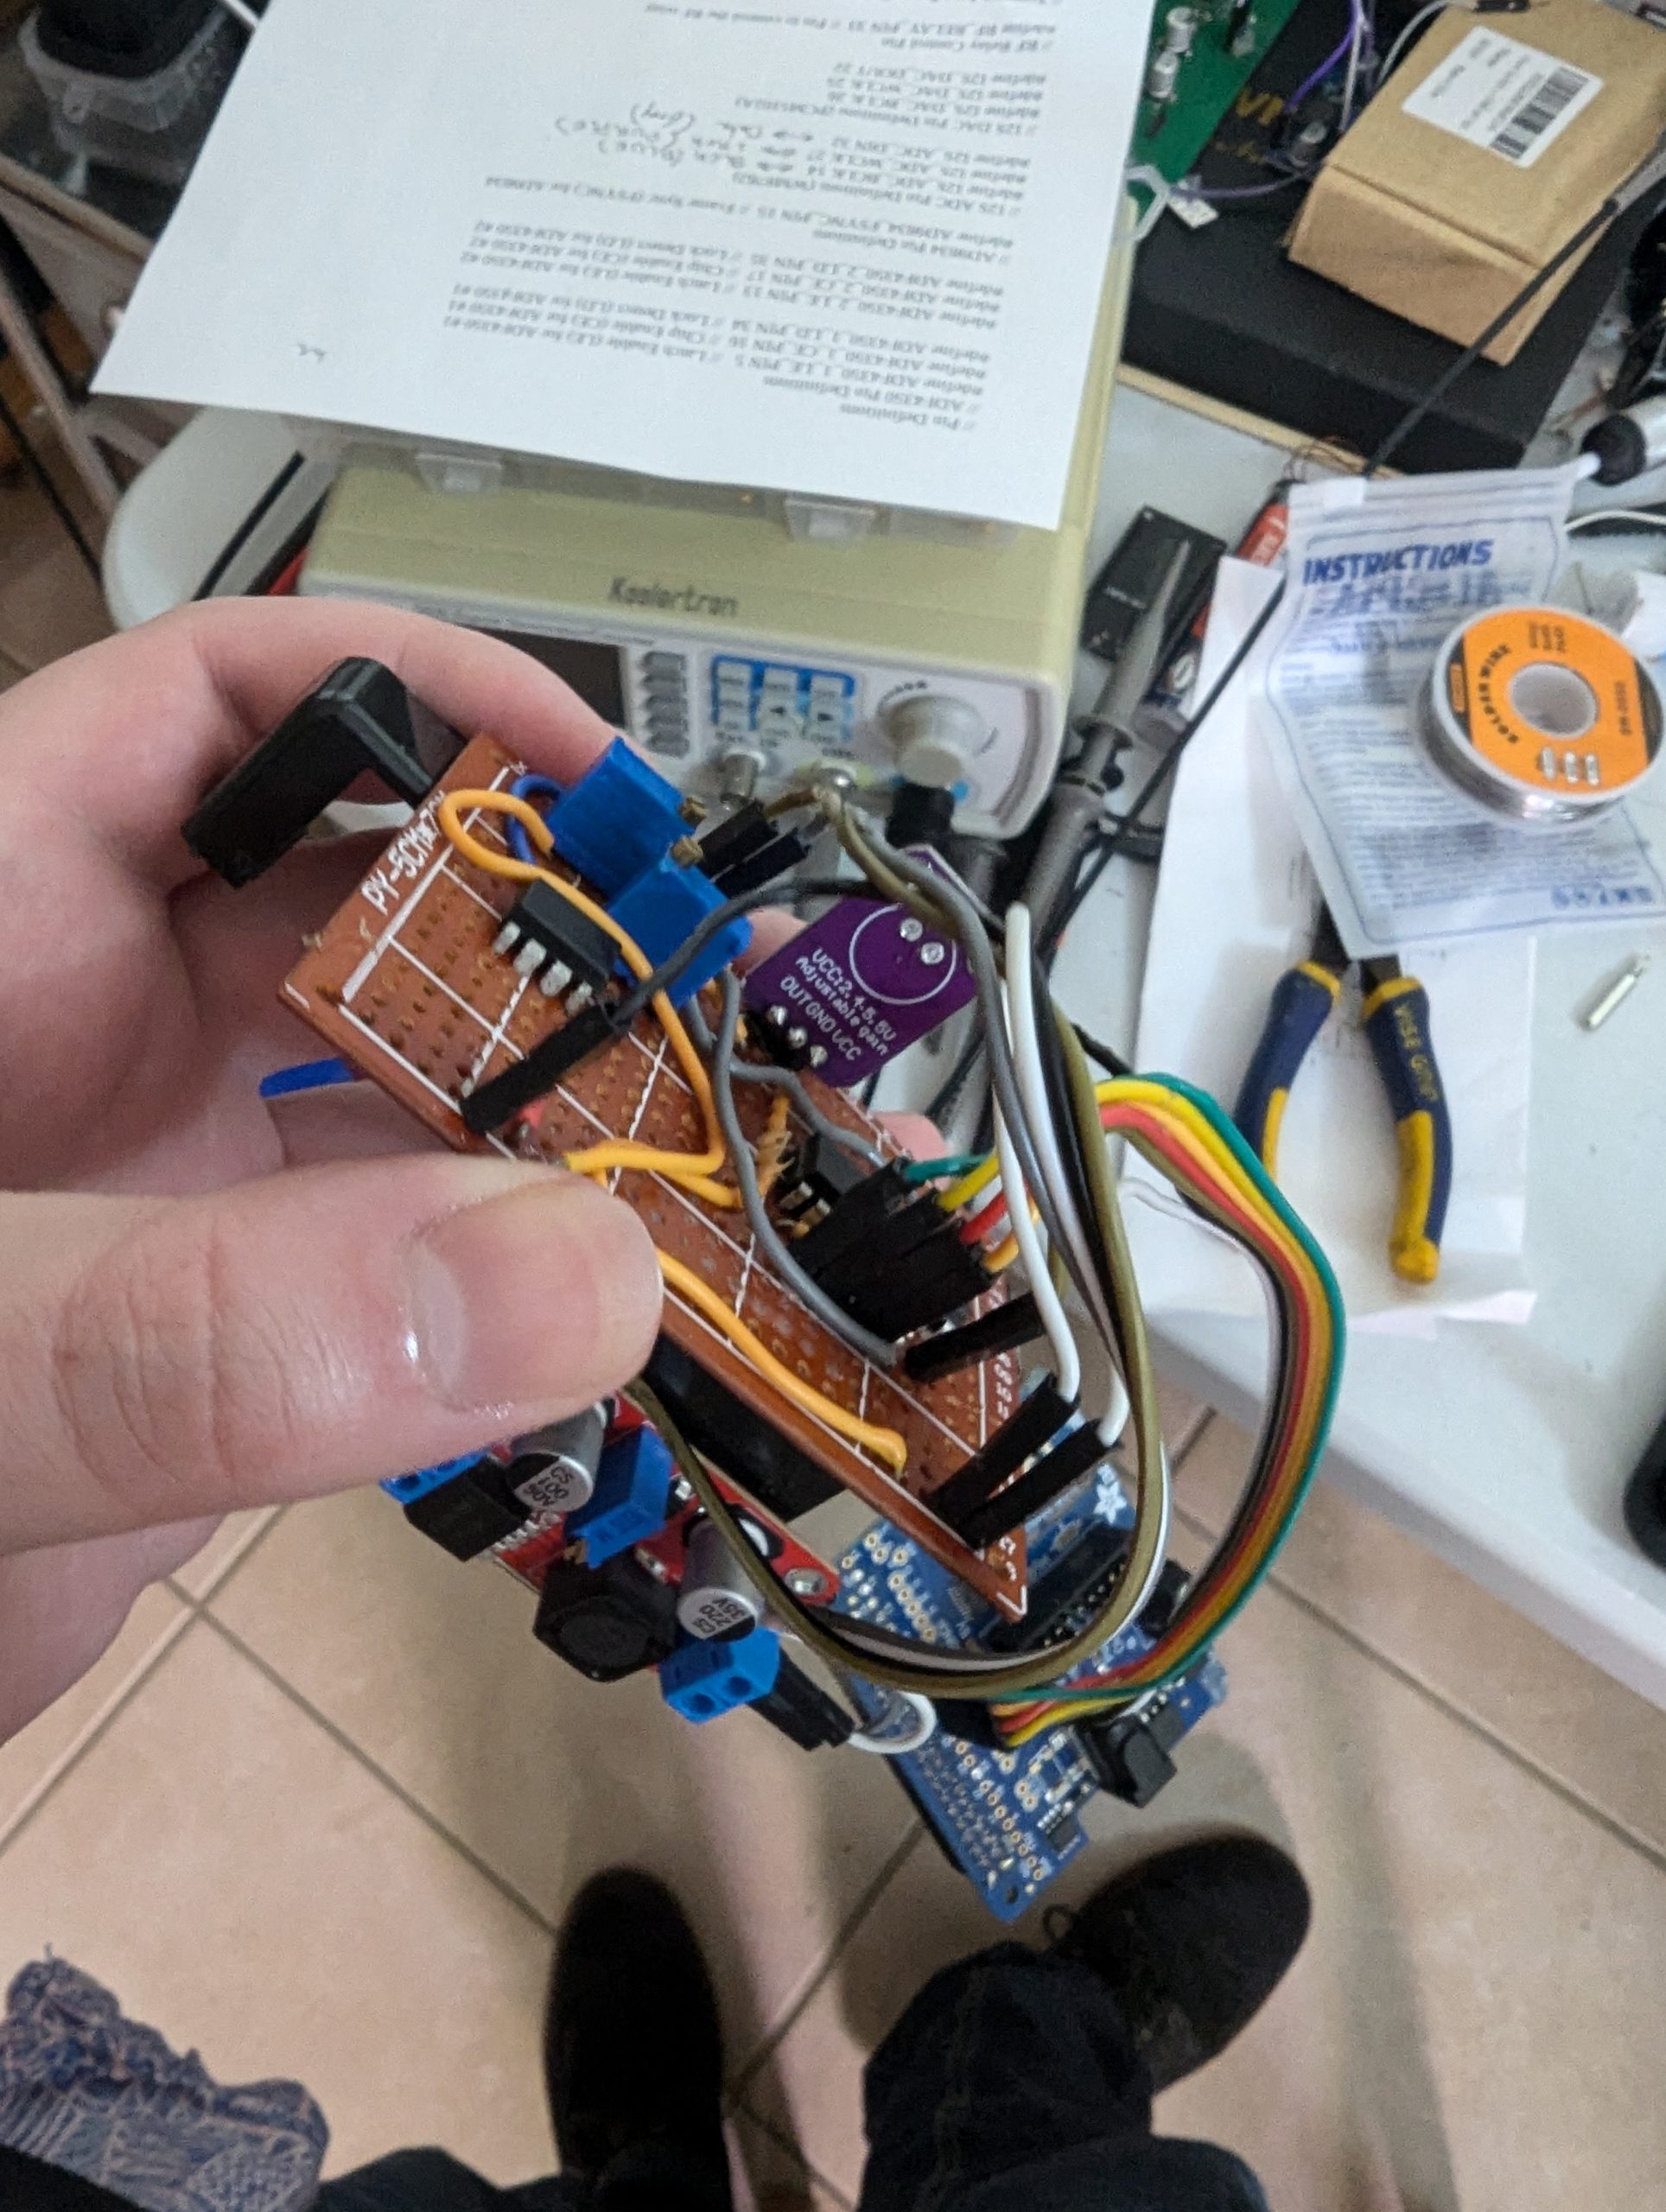
First crude ADC mic Module
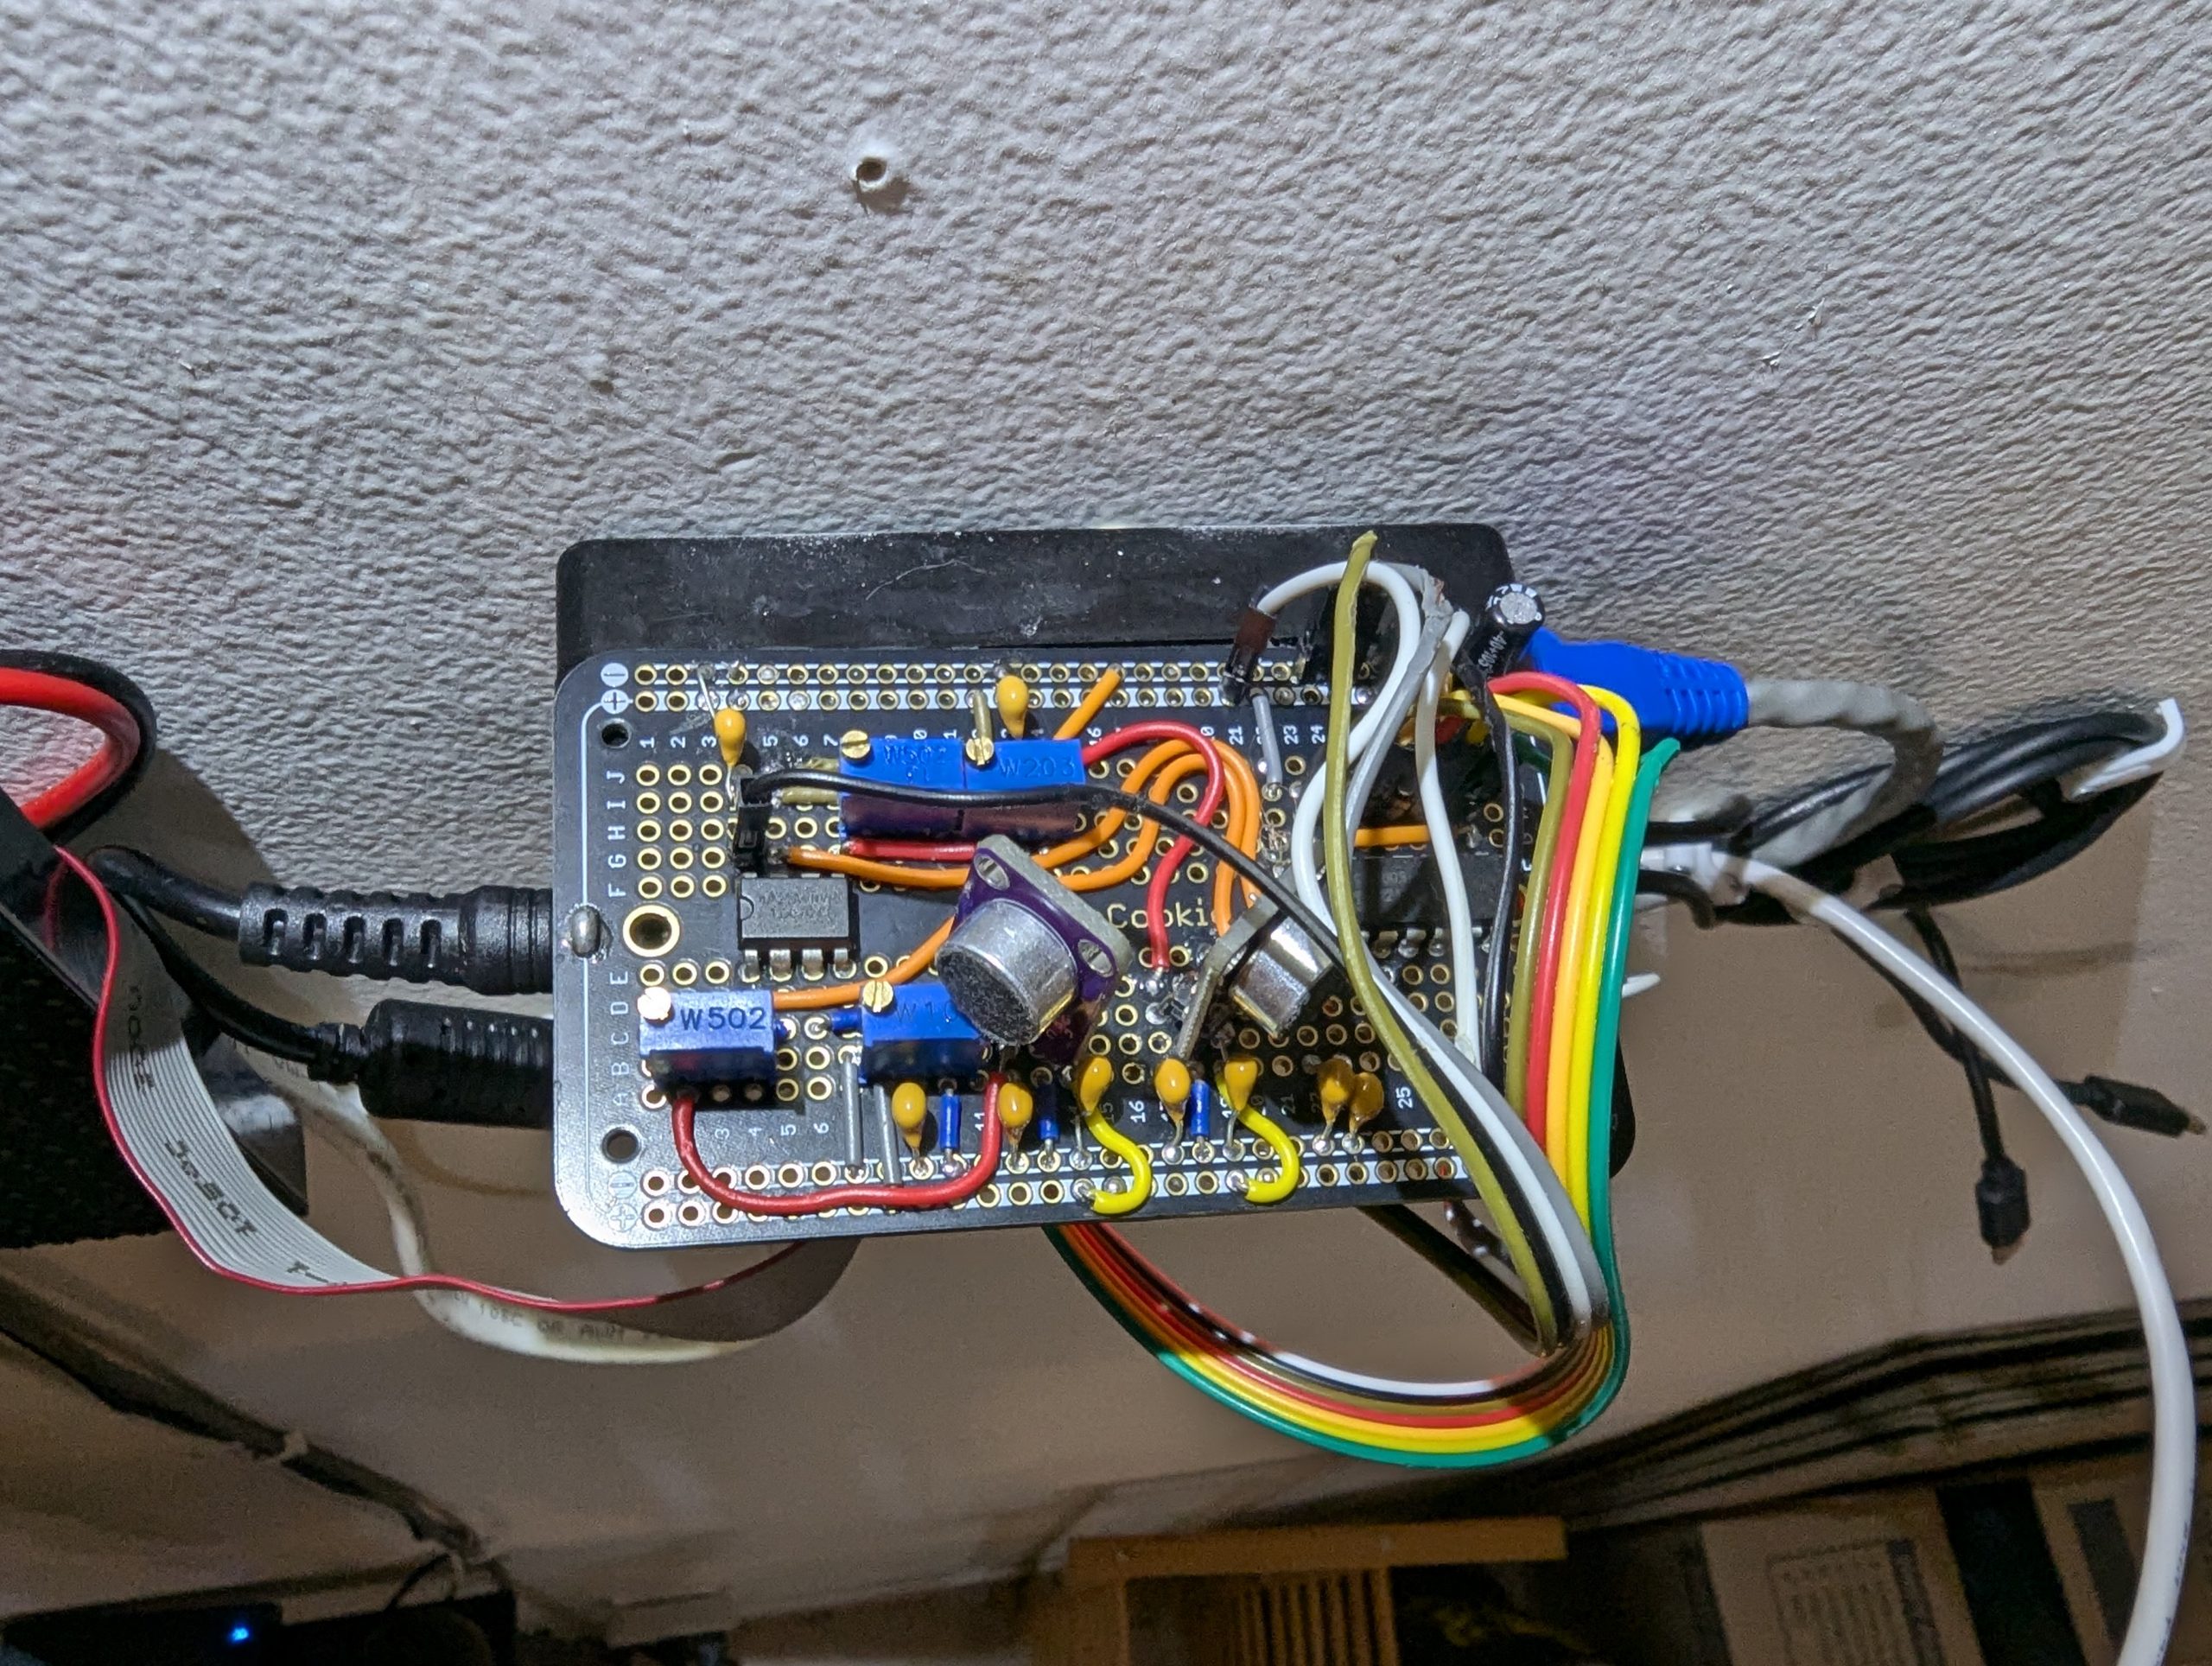
Second revision of ADC mic Module
Setup of Scheduled News Display
This guide assumes that like me you are running Raspbian on your Raspberry Pi and that your project code (named scheduled_display.py) resides in: /home/CharlesG/Scheduled_Display (replace CharlesG with your own username).
Scheduled path:
matrixdisplay.timer → triggers matrixdisplay.service → runs scheduled_display.py on
Manual test path:
MatrixDisplayTest.desktop → runs run_test.sh → runs scheduled_display.py on
1. System Preparation
1. Update and Upgrade Your System
Open a terminal and run:
sudo apt update
sudo apt upgrade -y
2. Install Python 3, pip, and Virtual Environment Tools
Ensure that Python and the necessary tools are installed:
sudo apt install python3 python3-pip python3-venv -y
3. Prepare system so that CPU core 3 is only used for matrix display output, this will reduce performance in other functions somewhat.
Edit the kernel boot parameters:
sudo nano /boot/firmware/cmdline.txt
At the very end of the single long line, add:
isolcpus=3
2. Set Up Your Project and Virtual Environment
1. Place Your Code
Make sure your Python program (scheduled_display.py) is in the directory:
/home/CharlesG/Scheduled_Display
2. Build and Install the LED Matrix Library
(The “rgbmatrix” module is not available via pip. You must build it from the rpi-rgb-led-matrix repository.)
Change to your home directory and clone the repository (if not already cloned):
cd /home/CharlesG git clone https://github.com/hzeller/rpi-rgb-led-matrix.git
Change to the cloned repository folder:
cd /home/CharlesG/rpi-rgb-led-matrix
Install Cython (if not already installed):
apt install cython3 -y
Build the Python bindings:
make build-python PYTHON=$(which python3)
Install the Python bindings system-wide:
sudo make install-python PYTHON=$(which python3)
3. Create a Virtual Environment with Access to System-wide Packages
This is important for accessing the rgbmatrix package if it’s installed system-wide.
cd /home/CharlesG/Scheduled_Display
python3 -m venv –system-site-packages venv
4. Activate the Virtual Environment and Install Required Packages
Activate your virtual environment:
source venv/bin/activate
Then install the necessary Python libraries:
pip install requests beautifulsoup4 feedparser yfinance
5. Test the Program in Test Mode
Run your program manually (using the test mode flag to bypass time restrictions):
/home/CharlesG/Scheduled_Display/venv/bin/python /home/CharlesG/Scheduled_Display/scheduled_display.py –test
Verify that your LED matrix displays content as expected.
3. Create a Wrapper Script for Test Mode
1. Create the wrapper script:
sudo nano /home/CharlesG/Scheduled_Display/run_test.sh
2. Paste:
/home/CharlesG/Scheduled_Display/venv/bin/python /home/CharlesG/Scheduled_Display/scheduled_display.py –test
3. Make it executable:
chmod +x /home/CharlesG/Scheduled_Display/run_test.sh
4. Configure Automatic Scheduling with systemd (Always Run as Root)
A. Create the systemd Service File
1. Edit the Service File
Open the file for editing:
sudo nano /etc/systemd/system/matrixdisplay.service
2. Paste the Following Content
This service file is configured to run as root, execute your program using the virtual environment’s Python interpreter, and run for 2 hours (from 8:00 to 10:00 if paired with the timer):
[Unit]
Description=LED Matrix Display Service
After=network.target
[Service]
User=root
WorkingDirectory=/home/CharlesG/Scheduled_Display
ExecStart=/home/CharlesG/Scheduled_Display/venv/bin/python /home/CharlesG/Scheduled_Display/scheduled_display.py
Restart=on-failure
RuntimeMaxSec=7200
[Install]
WantedBy=multi-user.target
3. Save and Exit
In nano, press Ctrl+O to save, Enter to confirm, and Ctrl+X to exit.
B. Create the systemd Timer File
1. Edit the Timer File
Open a new timer file:
sudo nano /etc/systemd/system/matrixdisplay.timer
2. Paste the Following Content
This timer schedules your service to start automatically at 8:00 AM each day:
[Unit]
Description=Run LED Matrix Display daily at 8 AM
[Timer]
OnCalendar=*-*-* 08:00:00
Persistent=true
[Install]
WantedBy=timers.target
3. Save and Exit
Again, press Ctrl+O to save, Enter, then Ctrl+X to exit.
C. Reload systemd and Enable the Service and Timer
1. Reload systemd to Apply Changes
sudo systemctl daemon-reload
2. Enable and Start the Timer
sudo systemctl enable matrixdisplay.timer
sudo systemctl start matrixdisplay.timer
3. Verify the Timer
Check the next scheduled trigger:
systemctl list-timers | grep matrixdisplay
Your service should now run at 8:00 AM and stop automatically after 2 hours.
5. Create a Desktop Icon for Test Mode
To test the display at any time, create a desktop shortcut that runs your program in test mode (with root privileges).
1. Create and Edit the Desktop File
Navigate to your Desktop folder:
cd ~/Desktop
nano MatrixDisplayTest.desktop
2. Paste the Following Content
This file runs your script in test mode (bypassing the time check):
[Desktop Entry]
Version=1.0
Name=Matrix Display Test (Root)
Comment=Launch the Matrix Display in test mode as root on CPU core 3
Exec=sudo /home/CharlesG/Scheduled_Display/run_test.sh
Icon=utilities-terminal
Terminal=true
Type=Application
Categories=Utility;
3. Save and Exit
Press Ctrl+O to save and Ctrl+X to exit.
4. Make the Desktop File Executable
chmod +x ~/Desktop/MatrixDisplayTest.desktop
6. Final Testing and Debugging
1. Automatic Mode:
Verify that your scheduled service starts at 8:00 AM by checking its status:
sudo systemctl status matrixdisplay.service
Monitor logs with:
sudo journalctl -u matrixdisplay.service -f
2. Test Mode via Desktop Icon:
Double-click the desktop icon (or run the Exec command manually) and verify that the LED matrix displays content in test mode. The terminal window should show output and any debugging messages.
3. Review Warnings:
If you see warnings about real-time thread priorities or color degradation, they should be resolved by running as root. If not, consider adjusting your system’s configuration (such as adding isolcpus=3 to /boot/cmdline.txt) as suggested in your program’s output.
Setup of Music Audio Spectrum Visualizer
This guide will walk you through setting up the environment and dependencies required to run my audio visualization program FFT_Audio_Display.py on your Raspberry Pi, including creating a virtual environment and setting up the desktop launcher. Running the other LED matrix program I mentioned earlier that just shows news headlines requires a somewhat simpler installation, with some overlap. Separate virtual environments are used for some of the library installations. This installation guide covers both versions of this project, the one that performs the FFT calculations in code on the Pi, and the separate project which makes use of an FPGA to offload those computations.
This guide assumes that your project code (named FFT_Audio_Display.y) resides in: /home/CharlesG/FFT_Audio_Display (replace CharlesG with your own username).
The folder /home/CharlesG/FFT_Audio_Display/ should contain at least:
• FFT_Audio_Display.py # The main Python code
• run_fft_display.sh # The wrapper script
• fft_env/ # Virtual environment directory
The basic logical flow will be:
1. Launch from Desktop icon (FFT_Display.desktop or UART_FFT_Display.desktop) →
Systemd service (fft_display.service or uart_fft_display.service) →
Launches wrapper script (run_fft_display.sh or run_uart_display.sh) →
Activates virtual environment (ftt_env or uart_env) →
Runs Python code with root permissions (FFT_Audio_Display.py or UART_FFT_Display.py)
───────────────────────────────────────────────────────────────
Step 1: System Preparation
1. Open a terminal and become root:
sudo -i
2. Update your Raspberry Pi OS:
apt update && apt upgrade -y
3. Install the necessary system packages:
apt install python3 python3-venv python3-pip git libatlas-base-dev -y
apt install python3-rpi.gpio python3-pillow -y
───────────────────────────────────────────────────────────────
Step 2: Prepare Your Project Directory
1. Create your project folder (if it doesn’t already exist):
mkdir -p /home/CharlesG/FFT_Audio_Display
2. Place your project files (including FFT_Audio_Display.py) into this folder.
───────────────────────────────────────────────────────────────
Step 3: Build and Install the LED Matrix Library
(The “rgbmatrix” module is not available via pip. You must build it from the rpi-rgb-led-matrix repository.)
1. Change to your home directory and clone the repository (if not already cloned):
cd /home/CharlesG git clone https://github.com/hzeller/rpi-rgb-led-matrix.git
2. Change to the cloned repository folder:
cd /home/CharlesG/rpi-rgb-led-matrix
3. Install Cython (if not already installed):
apt install cython3 -y
4. Build the Python bindings:
make build-python PYTHON=$(which python3)
5. Install the Python bindings system-wide:
sudo make install-python PYTHON=$(which python3)
───────────────────────────────────────────────────────────────
Step 4. Create Virtual Environment for the software FFT version (runs on Pi):
1. Change to your project directory:
cd /home/CharlesG/FFT_Audio_Display
2. Create a new virtual environment that includes system-wide packages:
python3 -m venv –system-site-packages fft_env
3. Activate the virtual environment:
source fft_env/bin/activate
4. Install additional Python dependencies inside the virtual environment:
pip install numpy gpiozero pyserial
Note: The rgbmatrix module is already installed system-wide, so it does not need to be installed in the virtual environment.
1. Step 4.5: Create Virtual Environment for the FPGA UART FFT version (data processed by FPGA, displayed by Pi):
1. Change to your project directory:
cd /home/CharlesG/UART_FFT_Display
2. Create a virtual environment that includes system-wide packages:
python3 -m venv –system-site-packages uart_env
3. Activate the virtual environment:
source uart_env/bin/activate
4. Ensure required packages are available:
pip install pyserial numpy
If these packages are already installed system-wide (as they are on most Raspberry Pi OS installs), pip will simply confirm that they’re already available in the environment.
───────────────────────────────────────────────────────────────
Step 5: Create the Wrapper Script for the software version
1. Create (or edit) the file run_fft_display.sh:
nano /home/CharlesG/FFT_Audio_Display/run_fft_display.sh
2. Paste the following content (adjust the Python version in PYTHONPATH if needed):
#!/bin/bash
echo “Running as user: $(whoami)”
# Activate the virtual environment
source /home/CharlesG/FFT_Audio_Display/fft_env/bin/activate
# Ensure PYTHONPATH includes the virtual environment
export PYTHONPATH=/home/CharlesG/FFT_Audio_Display/fft_env/lib/python3.9/site-packages: $PYTHONPATH
# Grant permissions to access GPIO memory
sudo chmod 666 /dev/gpiomem
# Run the Python script with sudo while preserving the virtual environment
sudo -E /home/CharlesG/FFT_Audio_Display/fft_env/bin/python3 /home/CharlesG/FFT_Audio_Display/FFT_Audio_Display.py
# Wait for user input so the terminal doesn’t close immediately
read -p “Press Enter to exit…”
3. Save the file (in nano: press Ctrl+O then Enter, and Ctrl+X to exit).
4. Make the wrapper script executable:
chmod +x /home/CharlesG/FFT_Audio_Display/run_fft_display.sh
Step 5.5: Create the wrapper script for the FPGA version
1. Create the script:
nano /home/CharlesG/UART_FFT_Display/run_uart_display.sh
2. Paste this script, then save and exit
#!/bin/bash
echo “Running as user: $(whoami)”
# Activate the virtual environment
source /home/CharlesG/UART_FFT_Display/uart_env/bin/activate
# Ensure PYTHONPATH includes the virtual environment’s packages
export PYTHONPATH=/home/CharlesG/UART_FFT_Display/uart_env/lib/python3.9/site- packages:$PYTHONPATH
# Optionally, allow access to GPIO if needed for LED matrix
sudo chmod 666 /dev/gpiomem
# Run the UART-based FFT display
sudo -E /home/CharlesG/UART_FFT_Display/uart_env/bin/python3 /home/CharlesG/UART_FFT_Display/UART_FFT_Display.py
# Wait for user input so the terminal doesn’t close immediately
read -p “Press Enter to exit…”
3. Make it executable:
chmod +x /home/CharlesG/UART_FFT_Display/run_uart_display.sh
───────────────────────────────────────────────────────────────
Step 6: Place the launcher on your regular user’s Desktop (visible in your normal session) but have it run with sudo
1. Create the desktop launcher file on your regular user’s Desktop:
nano /home/CharlesG/Desktop/FFT_Display.desktop
2. Paste the following content:
[Desktop Entry]
Name=Launch FFT Audio Display
Comment=Launch the FFT Audio Visualizer on RGB Matrix (as root)
Exec=sudo bash /home/CharlesG/FFT_Audio_Display/run_fft_display.sh Icon=utilities-terminal Terminal=true Type=Application
3. Save and exit.
4. Change the file’s ownership to your user and make it executable:
sudo chown CharlesG:CharlesG /home/CharlesG/Desktop/FFT_Display.desktop chmod +x /home/CharlesG/Desktop/FFT_Display.desktop
Step 6.5: For the FPGA Version
1. Open a terminal and create the file:
nano /home/CharlesG/Desktop/UART_FFT_Display.desktop
2. Paste the following content:
[Desktop Entry]
Name=FPGA UART FFT Display
Comment=Visualize FFT data streamed from FPGA over USB
Exec=sudo bash /home/CharlesG/UART_FFT_Display/run_uart_display.sh
Icon=utilities-terminal
Terminal=true
Type=Application
3. Save and exit.
4. Set ownership and permissions:
sudo chown CharlesG:CharlesG /home/CharlesG/Desktop/UART_FFT_Display.desktop
chmod +x /home/CharlesG/Desktop/UART_FFT_Display.desktop
───────────────────────────────────────────────────────────────
Step 7: (Optional) Create a systemd Service
If you want to run your visualizer as a service (manually started):
1. Create the service file:
nano /etc/systemd/system/fft_display.service
2. Paste the following content (update paths as necessary):
[Unit]
Description=FFT Display Service
After=network.target
[Service]
ExecStart=/bin/bash /home/CharlesG/FFT_Audio_Display/run_fft_display.sh
WorkingDirectory=/home/CharlesG/FFT_Audio_Display
StandardOutput=inherit
StandardError=inherit
Restart=always
User=root
Environment=”PYTHONPATH=/home/CharlesG/FFT_Audio_Display/fft_env/lib/python3.9/>
[Install]
WantedBy=multi-user.target
3. Save and exit.
4. Start the service manually (if desired):
systemctl start fft_display.service
7.5: For the FPGA Version
Create the service file:
sudo nano /etc/systemd/system/uart_fft_display.service
2. Paste the following content (update Python version in PYTHONPATH if needed):
[Unit]
Description=FPGA UART FFT Display Service
After=network.target
[Service]
ExecStart=/bin/bash /home/CharlesG/UART_FFT_Display/run_uart_display.sh
WorkingDirectory=/home/CharlesG/UART_FFT_Display
StandardOutput=inherit
StandardError=inherit
Restart=always
User=root
Environment=”PYTHONPATH=/home/CharlesG/UART_FFT_Display/uart_env/lib/pyth 3.9/site-packages”
[Install]
WantedBy=multi-user.target
3. Save and exit (Ctrl+O, Enter, Ctrl+X)
4. To start it manually:
sudo systemctl start uart_fft_display.service
5. To check its status:
sudo systemctl status uart_fft_display.service
6. To enable it at boot (optional):
sudo systemctl enable uart_fft_display.service
───────────────────────────────────────────────────────────────
Step 8: Test Your Setup
1. Test the Wrapper Script:
Run from the terminal:
bash /home/CharlesG/FFT_Audio_Display/run_fft_display.sh
Verify that your FFT audio display launches and that the LED matrix displays correctly.
2. Test the Desktop Launcher:
Double-click the desktop icon. If using Option B, you may be prompted for your sudo password.
3. (Optional) Test the systemd Service:
Check its status with: systemctl status fft_display.service
───────────────────────────────────────────────────────────────
Final Considerations
If you see suggestions about adding “isolcpus=3” at the end of /boot/cmdline.txt, this is for improving display update performance. Consider applying that tweak if needed.
Make sure all file paths (including Python version numbers in the PYTHONPATH) match your system configuration.
Ensure that only either hardware SPI or software SPI is used. Initializing both will cause the code not to launch properly.